
Articles > Analyzing The Amount of Phosphate in Water from Various Water Sources
Date uploaded: 15 May 2023
Analyzing The Amount of Phosphate in Water from Various Water Sources
Geon Ko, Christine Woo, Marine Jung
Abstract
This project used an EPA standard methodology to analyze natural waters and tap water from Scotland, PA, and Broadfording, MD, for phosphate content. The water samples were analyzed using the stannous chloride method, a spectrophotometric method from the Environmental Protection Agency (EPA), to evaluate the concentration of phosphate in water. Standards and samples were measured using the spectrophotometer with the light absorbance at 690 nm, the peak of the wavelength, to signify the phosphate concentration. The equation composed by making standards for each ppb was used to translate the absorbance to ppb concentration. The samples were filtered using the filtering apparatus and analyzed. The water near the Scotland campus and Broadfording campus was analyzed to compare the phosphate concentration of natural water and the purified water. Through the data, it was speculated that the phosphate concentration of the tap water acquired from the Scotland and Broadfording campuses was much higher than that of natural water
Introduction
Phosphate is an essential element for all life on this planet. Phosphate is mainly used to form the backbone structure of all nucleic acids (DNA and RNA) in the human body. It is also a major component of bones and teeth and is present in cell membranes and other soft tissues in the body. In addition, phosphate is essential for the proper growth, development, and reproduction of most plant and animal life [1].
The structure of the phosphate consists of one central phosphorus atom surrounded by four oxygen atoms with three single bonds and one double bond in a tetrahedral arrangement. Inorganic phosphates occur naturally in many forms and are usually combined with other elements. How phosphate gets distributed throughout Earth’s environment is described in detail in the phosphorus cycle.

Figure 1. Chemical Structure of Phosphate [2]
There are many “cycles” that are paramount to life on the planet Earth. In addition to the phosphorus cycle, there is also the water cycle, the carbon cycle, and the nitrogen cycle. Unlike the phosphorus cycle, these cycles all involve the Earth’s atmosphere. The phosphorus cycle consists of the decomposition of plant and animal life, putting the phosphorus into the soil, where it is mainly converted to an inorganic form [3]. Phosphorus can enter the long-term phosphorus cycle, which involves the rock cycle, or it can stay in the short-term phosphorus cycle, which includes the short-term terrestrial and aquatic cycle [4].
In the long-term phosphorus cycle, the phosphorus can be carried off by water and is incorporated into the sediment, forming into phosphate ions embedded in sedimentary rocks, and locked up in this form for millions of years before it re-enters the short-term phosphorus cycle. Some of this inorganic phosphorus is absorbed by plants directly from the soil. Plants are, in turn, consumed by animals, and predators consume animals. Some phosphorus remains in a mineral form when used by life forms (bones, teeth), and some is converted into an organic form (DNA, RNA, and soft tissues). Since the phosphorus is incorporated into organic compounds such as DNA when animals and plants decay after death, the phosphates from the animals and plants become the components of sediments and rock, staying sedentary for millions of years. Then, the phosphates are released back into the soil through the rain and weathering. The cycle eventually comes back and continues its cycle again [5].
Phosphate fertilizer is known for keeping plants healthy and encouraging new growth. As a natural source of phosphate, rock phosphate is essential for plants’ maturation and healthy growth. However, over-fertilization causes a massive problem by releasing contained phosphates that can lead to leaf chlorosis and destroy beneficial microorganisms in the soil. Moreover, the phosphate fertilizer risks water pollution because phosphates can tightly bind to the soil particles and are barely removed from the soil [6]. As a result, phosphate tends to build up in the soil. Besides, when the heavy rain comes down, the phosphate subsequently causes excess phosphorus to seep into different water sources: creeks, streams, rivers, and lakes [7]. This excess amount of phosphorus brings environmental contamination issues and the overgrowth of bacteria and aquatic plants such as algae. Within the soil, organic forms of phosphate can be made available to plants by bacteria that break down organic matter into inorganic forms of phosphorus. This process is known as mineralization.
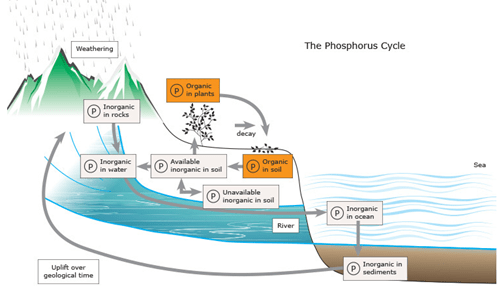
Figure 2. The Phosphorus Cycle [8]
In addition to light, algae are also dependent on the availability of nutrients such as nitrate, phosphate, or silicic acid for growth. The dissolved phosphates, therefore, precipitate the algal growth. Cyanobacteria, the blue-green algae, produce microcystins that destroy the ecosystems with extreme toxicity. Algae bloom has been a severe environmental issue caused by phosphorus, which originates from algae phenomena. Red tides are also a type of harmful algal blooms that grow out of control while producing toxic or harmful effects on people, fish, marine mammals, and birds. When vast blooms occur, these poisons may spread through the environment and the food chain to fish and animals that feed on them [9]. Also, the overgrowth of algae consumes oxygen and blocks sunlight from underwater plants. When the algae eventually die, the oxygen in the water is consumed. The lack of oxygen makes it difficult for aquatic life to survive [10]. A phosphate-based algal bloom has negatively affected the environment such as the Mississippi river, the Huang-He (Yellow) river in China, and the Indus and Ganges rivers in India. Less-populated regions such as Australia and northern Africa also suffer from high water pollution levels because of the algae blooms [11].
As phosphates foster algae growth, they affect human health in turn. Usually, phosphori are used to form and keep our bones strong, activate our brains and nervous systems, form the membrane of our cells, facilitate oxygen delivery in our body, maintain our energy levels, and average acid balance (pH) [12].

Figure 3. Functions of Phosphorus [13]
Phosphates are abundant in the human diet. About 40% to 80% of the phosphates are absorbed by the intestine. However, there are also harmful effects of excess amount of phosphate present. The excess amounts of phosphate can directly lead to cell toxicity, which can cause dysregulation of cell signaling, oxidative stress, apoptosis, and inflammation of the cell. In addition, high intratubular phosphate can cause kidney disease progression. Phosphate can also stimulate PTH secretion and FGF23 secretion, leading to renal anemia, immune dysfunction, muscle atrophy, browning of adipose tissue, and more, leading to poor immune status [14].
The amount of phosphate must be kept at an ideal concentration for the environment to be appropriately maintained. Phosphate(phosphorus) promotes the growth of plankton and aquatic plants. It also helps the human body by building and repairing bones and teeth. However, the excess portion of phosphate would harm the environment by increasing the growth of algae and large aquatic plants, resulting in decreased levels of dissolved oxygen, Eutrophication. The ideal phosphate concentration should be less than 0.05 ppm in tap water, 0.1 ppm in creeks, and 0.05 ppm in lakes.
Samples are collected from different environments, and the phosphate concentrations are then indicated by variation of color intensity after going through chemical reactions. First, the numerical concentration values are determined in relation to the color intensity of the phosphate standard. Then, the values are compared with ideal concentrations to conclude whether the phosphate levels from each sample site are appropriate.
Results & Discussion
Figure 1 shows the calibration curve for the 1000 µL micropipette. Calibration was done by repetitive trials of pipetting at each 400, 600, 800, 900, and 1000 µL. The temperature was measured by using 5 different thermometers by taking the average of those five measurements. Then, the density was calculated considering that of water. Measurements for each trial were done on an analytical balance and the results were taken on average to indicate calibration data. The figure shows the resulting calibration curve. The equation for this calibration was also determined with its coefficient of determination of 0.99856. Every pipetting of materials was done using this calibration equation.
Figure 2 shows the calibration data of standard solutions. The phosphate concentration was indicated by the relative absorbance at 690 nm. The spectrophotometer was used to yield this dataset. Starting from a stock solution with 1000 ppm, standard solutions for each concentration were made by dilution. Concentration for standard solutions was each 5, 10, 20, 40, 50, 100, 150, 250, and 300 ppb. Using standard solutions for each concentration, a spectrophotometer was run for multiple trials. The sample color was blueish with variation in intensity according to different concentrations. Absorbance at 690 nm, which was the peak, was then taken and the average was taken to yield each absorbance at a given concentration. The equation showing relation between concentration and absorbance was calculated with its coefficient of determination (R²) of 0.999701. This calibration curve was significant as becoming the standard to further determine the phosphate concentration for samples.
Table 1 shows the data collected from samples from different sites. Samples were taken from each different site for water sources. As mentioned in the procedure, the samples were filtered since they were somewhat high in turbidity. Both unfiltered and filtered samples were run for spectrophotometry and resulting absorbances were recorded. With the resulting absorbance, phosphate concentration for each sample was calculated using Figure 2 as reference.
The samples were first collected from outdoor sites: creek, pond, fishing creek, and Monocacy lake in Scotland, PA. For ponds, the phosphate concentrations were determined to be about 5~50 ppb. For creeks, the phosphate concentrations were determined to be about 10 ppb. The sensitivity of the spectrophotometer was limited and any phosphate concentrations below 10 ppb were not clear. Yet, the phosphate concentration under 10 ppb was still thought to be extremely low. For both fishing creek and Monocacy lake, the phosphate concentrations were determined to be about 4 ppb.
Other samples were collected from various water sources in the Scotland campus educational building and cottages. For tap water in the Chemistry laboratory, located in the basement of the educational building, the phosphate concentration was determined to be about 50 to 70 ppb. For tap water from the basement male bathroom, the concentration was about 50 ppb. The concentration from the library café was about 80 to 90 ppb. The samples collected from the cottage sinks were determined to contain at most 100 ppb of phosphate concentration. The concentrations from tap water throughout the campus were much higher than EPA standard level, which is about 50 ppb. Thus, for possible such high phosphate detection, the research was further taken to drinking water sources. The phosphate concentrations from first-floor drinking fountains were about 50 ppb, which is right on the verge of the standard level. Yet, concentration from the second-floor drinking fountain on the second floor was extremely high; repetitive results show the concentration is about 120 ppb. These results turned out to be significant that the drinking fountain contained phosphate more than two times the amount of EPA standard level. However, the drinking water from the cottages contained phosphate close to zero ppb. This turned out to be caused by the filtering machine that was connected to the drinking hose.
In 2023, various samples were collected in the Broadfording campus educational building and other sources, such as the treatment plant. For the tap water from Janitor’s closet in Ptree building, the average phosphate concentration was determined to be 287.903 ppb. For the gym drinking fountain water, the average phosphate concentration was determined to be 278.876 ppb. For the treatment plant water, the average phosphate concentration was determined to be 2971.561. Since the value was too high, it is assumed that the spectrophotometer utilized cannot analyze the exact amount of absorbance well. Thus, the water sample was diluted to 1 ml out of 25 ml during the experiment. The concentration of phosphate for the diluted treatment plant water was determined to be 220.683. If this value is multiplied by 25, it can be evaluated that the actual concentration of phosphate for the treatment plant is 5517.087 ppb. For the kitchen tap water, the average phosphate concentration was determined to be 309.827 ppb. The effluent from the treatment plant was also analyzed. After diluting 1 gram of the samples, the average phosphate concentration was determined to be 276.978. It can be concluded that the actual phosphate concentration is 6924.227 ppb, since the samples were diluted.
Figure 4. 1000 µL Pipette Calibration Curve and Equation
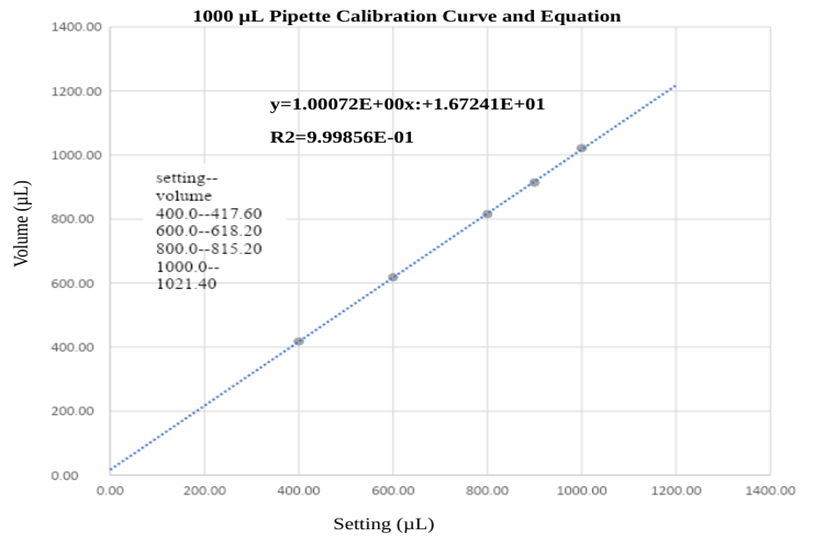
Figure 5. Calibration Curve: Phosphate (ppb as P) Compared to Absorbance

Table 1. The Absorption of Light According to Phosphate (ppb as P) Level
| Sample name | Date | Time (min) | Filtering Status | Absorbance | Phosphate (ppb as P) |
| 001_creek | 03012022 | 11 | Filtered | 0.006849 | 5.341 |
| 002_chemistry_tapwater | 03182022 | 11 | Filtered | 0.05759 | 55.68 |
| 003_pond | 03222022 | 11 | Filtered | 0.005944 | 57.51 |
| 004_ creek | 03222022 | 11 | Filtered | 0.008424 | 6.904 |
| 005_ creek | 03222022 | 11 | Filtered | 0.01164 | 10.09 |
| 006_ pond | 03222022 | 11 | Filtered | 0.01037 | 8.834 |
| 007_chemistry_tapwater | 03222022 | 11 | Filtered | 0.07299 | 70.96 |
| 008_fishingcreek | 03252022 | 11 | Filtered | 0.005775 | 4.276 |
| 009_ monocacy | 03252022 | 11 | Filtered | 0.006415 | 4.911 |
| 010_ creek | 04052022 | 11 | Filtered | 0.003445 | 1.964 |
| 011_ pond | 04052022 | 11 | Filtered | 0.006841 | 5.333 |
| 012_bastementmalerestroom | 04072022 | 11 | Filtered | 0.05934 | 57.42 |
| 013_ creek | 04282022 | 11 | Filtered | 0.002035 | 0.5655 |
| 014_ library_cafe | 05042022 | 11 | Filtered | 0.07685 | 74.79 |
| 015_ 1stfloor_drinkingfountain | 05062022 | 11 | Filtered | 0.004884 | 3.3919 |
| 016_ 2ndfloor | 05042022 | 11 | Filtered | 0.09482 | 92.61 |
| 017_ library_ cafe | 05042022 | 11 | Unfiltered | 0.09510 | 92.89 |
| 018_ 1stfloor_ drinkingfountain | 05042022 | 11 | Unfiltered | 0.05370 | 51.82 |
| 019_ 2ndfloor | 05042022 | 11 | Unfiltered | 0.09491 | 92.70 |
| 020_ 2527cottagesink | 05102022 | 11 | Filtered | 0.1093 | 107.0 |
| 021_ 2527cottagesink | 05052022 | 11 | Unfiltered | 0.02473 | 23.08 |
| 022_ 2123cottagedrinkingwater | 05102022 | 11 | Filtered | 0.005542 | 4.045 |
| 023_ 2123cottagesink | 05102022 | 11 | Filtered | 0.1035 | 101.2 |
| 024_ 1stfloorcafe | 05112022 | 11 | Filtered | 0.08532 | 83.19 |
| 025_ 1stfloor_drinkingfountain | 05112022 | 11 | Filtered | 0.05536 | 53.47 |
| 026_ 2ndfloor | 05112022 | 11 | Filtered | 0.1271 | 124.6 |
| 027_ 1stfloor_ cafe | 05102022 | 11 | Unfiltered | 0.08496 | 82.83 |
| 028_ 1stfloor_drinkingfountain | 05102022 | 11 | Unfiltered | 0.06052 | 58.59 |
| 029_ 2ndfloor | 05102022 | 11 | Unfiltered | 0.1324 | 129.90 |
| Data from Broadfording Campus in 2023 | |||||
| 001_Tap water from Janitor’s closet in Ptree building | 03222023 | 10 | Unfiltered | 0.232722 | 266.331844 |
| 002_Gym Drinking Water | 03222023 | 11 | Unfiltered | 0.238732 | 273.555864 |
| 003_Treatment Plant Water | 03222023 | 11 | Unfiltered | 3.26905 | 3915.9981 |
| 004_Kitchen Tap Water | 03222023 | 10 | Unfiltered | 0.277694 | 320.388188 |
| 005_Tap water from Janitor’s closet in Ptree building | 03292023 | 10 | Unfiltered | 0.280869 | 324.204538 |
| 006_Gym Drinking Water | 03292023 | 10 | Unfiltered | 0.245519 | 281.713838 |
| 007_Treatment Plant Water | 03292023 | 10 | Unfiltered | 3.3615 | 4027.123 |
| 008_Kitchen Tap Water | 03292023 | 10 | Unfiltered | 0.286164 | 330.569128 |
| 009_Treatment Plant Water | 03292023 | 10 | Unfiltered | 0.194745 | 220.68349 |
| 010_1-gram diluted chicken poop | 04122023 | 10 | Unfiltered | 1.42021 | 1693.69242 |
| 011_0.5-gram chicken poop | 04122023 | 10.5 | Unfiltered | 0.678184 | 801.777168 |
| 012_1-gram diluted effluent | 04122023 | 10.5 | Unfiltered | 0.239573 | 274.566746 |
| 013_Tap water from Janitor’s closet in Ptree building | 04192023 | 10 | Unfiltered | 0.238412 | 273.171224 |
| 014_Kitchen Tap Water | 04192023 | 10 | Unfiltered | 0.242864 | 278.522528 |
| 015_Gym Drinking Water | 04192023 | 10.5 | Unfiltered | 0.245224 | 281.359248 |
| 016_1g diluted effluent | 04192023 | 10.5 | Unfiltered | 0.243585 | 279.38917 |
The research was conducted for the purpose of investigating the amount of phosphate in water from various sources throughout different areas. As introduced earlier, high amounts of phosphates may harm the natural environment and more serious human society. To determine the phosphate amounts with clear criteria, standard solutions with different phosphate concentrations were made and run spectrophotometer. Light absorbance at 690 nm (peak) was taken for each concentration level to signify a definite phosphate concentration. Samples were taken from accessible places both from outdoor and indoors. It was assumed that the concentrations from outdoor areas would be much higher by the effect of the phosphate cycle and chemicals that humans abuse.
The results were unexpected: the actual concentrations were much higher in indoor places on the Scotland campus. The samples were collected from places where students and faculty members are intact. This gave rise to the significance of our research that the level of phosphate detected was much higher than the EPA standard level. It was concluded that further investigation of water quality is required for the Scotland, PA, and more specifically for the Scotland campus.
In 2023, this research was conducted again to evaluate the amount of phosphate in water from Global Vision Christian School – Broadfording campus. The samples were collected from different sources where students and faculty members use ordinarily. After the experiment, it was found that the concentrations of phosphate in various water sources were much higher than EPA standard. In addition, tremendous amounts of phosphate were detected in the water coming out of the treatment plant. After the experiment, it was determined that the large amount of phosphate from the chicken fertilizer used during spring break for the microbe in the treatment plant would have made water purification difficult. Thus, it was concluded that further investigation of water quality is required for the Broadfording campus.
ACKNOWLEDGMENTS
We thank Dr. Birnbaum, our research advisor, for leading us to have this wonderful laboratory experiment.
REFERENCES
[1] Hidgon J (2014) Phosphorus. Linus Pauling Institute. Available at: https://lpi.oregonstate.edu/mic/minerals/phosphorus.
[2] NEUROtiker (2008) Stereo Skeletal Formula of Phosphate Available at:
https://en.wikipedia.org/wiki/Phosphate#/media/File:Phosphat-Ion.svg.
[3] The Phosphorus Cycle (2013) Science Learning Hub. Available at:
https://www.sciencelearn.org.nz/resources/961-the-phosphorus-cycle.
[4] Turner BL, Raboy V (2019) Phosphorus Cycle. Access Science. Available at:
https://www.accessscience.com/content/article/a508930.
[5] What Happens To The Phosphates When Plants And Animals Die Micro B Life. Available at:
https://www.microblife.in/what-happens-to-the-phosphates-when-plants-and-animals-die/.
[6] Espiritu K (2020) How to Use Rock Phosphate Fertilizer in Your Garden. Epic Gardening. Available at:
https://www.epicgardening.com/rock-phosphate/.
[7] Kolifrath J (2020) What Are The Side Effects of Using Phosphate-Based Fertilizers? Home Guides | SF Gate. Available at:
https://homeguides.sfgate.com/side-effects-using-phosphatebased-fertilizers-96523.html.
[8] The Phosphorus Cycle (2013) (University of Waikato) Available at:
https://www.sciencelearn.org.nz/resources/961-the-phosphorus-cycle.
[9] Neuhaus L (2016) Miles of Algae and a Multitude of Hazards. The New York Times. Available at:
https://www.nytimes.com/2016/07/19/science/algae-blooms-beaches.html.
[10] The Effects: Dead Zones and Harmful Algal Blooms EPA. Available at:
https://www.epa.gov/nutrientpollution/effects-dead-zones-and-harmful-algal-blooms.
[11] Mathiesen K (2013) China’s largest algal bloom turns the Yellow Sea green. The Guardian. Available at:
https://www.theguardian.com/environment/2013/jul/04/china-algal-bloom-yellow-sea-green.
[12] Phosphorus: foods, functions, how much do you need & more (2021) Eufic. Available at: https://www.eufic.org/en/vitamins-and-minerals/article/phosphorus-foods-functions-how-much-do-you-need-more.
[13] Functions of Phosphorus (2021) Available at: Phosphorus: foods, functions, how much do you need & more (2021) Eufic. Available at:
https://www.eufic.org/en/vitamins-and-minerals/article/phosphorus-foods-functions-how-much-do-you-need-more.
[14] Komaba H, Fukagawa M (2016) Phosphate-a poison for humans? ScienceDirect. Available at:
https://www.sciencedirect.com/science/article/pii/S0085253816301375.
Main Editor: Joon Ko
jko1@gvcspa.org
Global Vision Christian School Broadfording
13535 Broadfording Church Rd, Hagerstown
Website Manager: Gyeongwoo Yuk
gyuk1@gvcspa.org
